1. Noise in Electrical Circuits, and The Need for Reduction of Noise.
Electronic components are basically made up of materials that contain electrical charges. These electrical charges are built due to electrons movements within the component. Due to quantum nature of these electrons, an electrical component produces noise at temperatures other than absolute zero (00 K). Due to this fundamental nature of materials to induce noise, it is impossible to remove noise completely from an electrical circuit at room temperatures (or the temperatures at which it operates). In other words, material properties, thermal fluctuations, discreteness of electrical charges, and junction temperatures are the primary cause of noise
Why do we want to remove or contain the noise in an electrical circuit? The reasons for reducing noise may be any of the following:
-
To improve sensitivity of the circuit to detect desired signals in a receiver.
-
To reduce harmonic content and phase noise in a transmitter,
-
To improve output signal to noise ratio.
For example, take satellite TV. The signals your antenna dish receives are of the order of -100dBm
Note: 1 mW (1X10⁻³ W) = 0dBm,
1 mW(1X10⁻⁶W) = -30dBm and so on.
To receive a signal of this magnitude, the noise levels should be comfortably below –100dBm. This requires careful design and manufacture of electrical components (both active and passive), and assemblies.
2. Types of Noise sources:
There are several types of noise sources in electrical circuits. However, we discuss only threee important noise sources here.
1. Thermal or Johnson Noise
2. Shot Noise
3. 1/f Noise (Also called Flicker or Pink noise)
1. Thermal Noise: This is the noise generated by thermal agitation of electrons in a conductor.
The noise power, P, in watts, is given by P = kT D f,
Where, k is Boltzmann's constant in joules per Kelvin,
T is the conductor temperature in Kelvin, and
D f is the bandwidth in hertz.
Note that thermal noise power, per hertz, is equal throughout the frequency spectrum, depends only on k and T. The Thermal noise is also called Johnson’s noise.
2. Shot Noise: Shot noise normally occurs when there is a potential barrier (voltage differential). PN junction diode is an example that has potential barrier. When the electrons and holes cross the barrier, shot noise is produced. For example, a diode, a transistor, and vacuum tube will all produce Shot noise. On the other hand, a resistor normally does not produce Shot noise since there is no potential barrier built within a resistor. Current flowing through a resistor will not exhibit any fluctuations. However, current flowing through a diode produces small fluctuations. This is due to electrons (in turn, the charge) arriving in quanta, one electron at a time. The current flow is not continuous, but limited by the quantum of the electron charges.
When a mean current I flows, Shot noise leads to current fluctuations given by
I2(f) = 2eI0A2/Hz
Where, e (1.6 x 10⁻¹⁹ coulombs). is the electronic charge.
Shot noise is proportional to the current passing through the devise.
3. 1/f (one-over-f) Noise: 1/f noise is found in many natural phenomena such as nuclear radiation, electron flow through a conductor, or even in the environment. In electrical engineering, it is called also Flicker noise.
1/f noise is refers to a time series with random fluctuations. The power spectra S(f) as a function of the frequency f is given by
S(f) = 1/f b
Where, b is very close to 1.
However, note that this formula may not be applicable under all circumstances.
Flicker noise is more prominent in FETs, and bulky resistors.
d. White Noise: White noise is the noise that has constant magnitude of power over frequency. Examples of White noise are Thermal noise, and Shot noise.
3. Noise in Electronic Components:
a. Resistor Noise:
Only thermal noise is significant in passive components like a resistor. Resistor noise can be represented as a noise voltage source in series with the resistor as shown below..

The noise voltage En primarily depends on three factors:
-
Resistor value,
-
The bandwidth and
-
The temperature
The noise Voltage is given by,

where
En= the Root-Mean-Square or RMS voltage level
k= Boltzmans constant (1.38*10-23)
T= Temperature in Kelvin (Room temp = 27 °C = 300 K)
R= Resistance in Ohms
Δf = Circuit bandwidth in Hz
As an example, that 100 kΩ resistor with 1MHz bandwidth will add noise to the circuit as below:
En= ( 4 *1.38*10-23 *300 * 100*103*1*106) ½
=40.69 μV RMS
2. Noise Power:
The noise power, or Mean-Square noise, is the square of noise voltage a given here.
P = E2n = 4 k T R Δf
Note that the Noise power increases proportionately with temperature. By limiting the circuit bandwidth to the desired frequencies, we can limit the noise power contributed to the circuit.
3. Junction Diode and Transistors: A junction diode will typically have two components of noise. One is thermal noise, and the other is shot noise. Note that if the active device provides amplification, the noise also gets amplified along with the signal.
4. Two-port Network Characterization:
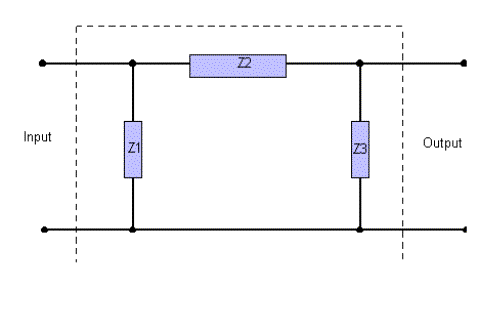
A two-port network can be represented as below:

The noise in a circuit can be characterized by the following parameters:
-
Gain, G
-
Bandwidth, B
-
Noise Figure, F
Assuming that the input is driven by noise temperature at T, the output noise of the two-port network is given by kTGBF, where G is the gain, B is the bandwidth, and F is the Noise figure of the circuit under consideration.
5. What is Noise Figure:
Noise Figure is defined as the ratio of signal to noise ratio at the output to that at the input. In other words,
NF= (s/n)i/(s/n)o
Where (s/n)I is the signal to noise ratio at the input, and (s/n)o is the signal to noise ratio at the output of the device under test. Note that s/n at the output will always be smaller than the s/n at the input, due to the fact that any circuit will only add to the noise, but never reduces the noise present in the system.
(S/N)in=(signal power) in /(noise power) in
= S in /N in
(S/N)out=(Signal Power)out/(Noise Power)out
=Sout/Nout= [S in *G]/[G*Nin + Ndut]
Ndut is the noise power due to the device.
(S/N)in/(S/N) out
= [S in /Nin]/[S in *G/[ G*Nin + Ndut]
= [G*Nin + Ndut]/[ GNin]
Effective Noise Temperature:
Let us assume that Te (called Effective Noise Temperature) is the noise temperature that results in Ndut. Then Te is related to the Ndut as follows:
Ndut = KGB*Te
or
Te= Ndut /[KGB]
Also we know at room temperature, Nin =KT0B
Substituting the values in the above formula,
F=[G*Nin + Ndut]/[GNin] = [T0 + Te]/T0
Or Te = T0(F-1)
F expressed in linear terms is called Noise Factor. In log terms, F is called Noise Figure.
F dB = 10logF
6. Noise Figure Measurement Techniques:
There are atleast three ways to measure the noise figure of a device. These are:
-
Using Noise Figure Meter
-
Excess Noise Ratio -ENR of Noise Source
-
Calibration
-
Measurement
-
Factors that you need to consider when choosing equipment for Noise Figure measurement:
-
Advantages and disadvantages of this method
-
Gain Method,
-
Formulas for noise figure measurement
-
Measurement technique used
-
Advantages of using this method
-
Disadvantages of this method
-
Y Factor Method
-
What isY-Factor
-
Advantages of using Y Factor method
-
Disadvantages of this method
Each method has its own advantages and disadvantages.
1. Noise Figure Measurement using Noise Figure Meter:
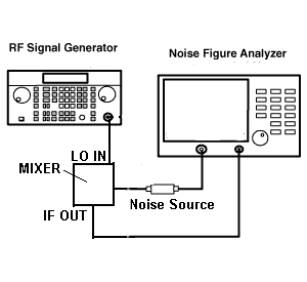
The equipment connections are as shown in the diagram below. A mixer may be necessary if you want to convert the RF frequencies to desired IF frequencies. In case you don’t need a frequency mixer, simply connect the IF OUT cable to the Noise Source, and calibrate.
a. Excess Noise Ratio (ENR): ENR is frequently used to denote the noise that a calibrated noise source delivers to a DUT.

Where Th is the hot temperature (Corresponds to Noise source ON)
Tc is the Cold temperature (Corresponds to Noise source OFF)
At room temperatures, Tc = T0

The ENR needs to be entered into the Noise Figure Analyzer corresponding to the frequency of measurement. Normally, the ENR table is prominently displayed on the Noise Source.
b. Calibration procedure: First the equipment needs to be calibrated. The calibration procedure normally involves inputting the ENR (Excess Noise Ratio) as given on the Noise Source in to the Noise Figure Analyzer at the desired frequency range. This will establish the base level against which the DUT noise figure will be measured.

c. Measurement of Noise Figure and Gain:
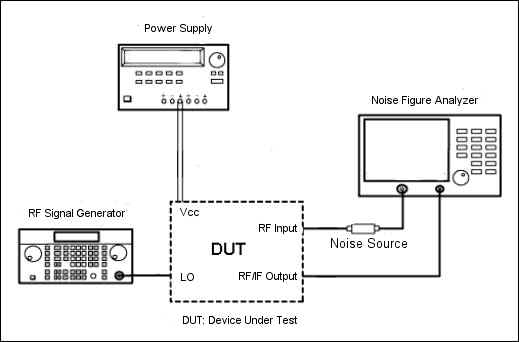
The following figure shows the diagram with required connections with DUT. Once the test equipment is calibrated for Noise Figure, (and Gain, as it is normally measured along with the Noise Figure) by simply connecting the DUT in to the calibrated set up as below will display the Gain and Noise Figure of the DUT.

It is possible that you use any connector adapters or attenuators during the measurement process to ensure that the measured values are within the range of the Noise Figure Analyzer. In such case, you may to include the adapters or attenuators during the calibration process itself (not shown in the figure).
d. Factors that you need to consider when choosing equipment for Noise Figure measurement:
-
Expected Noise Figure: NF Analyzer is suitable to measure Noise Figure when the value is small (say less than 10dB typical). If you intend to measure very high value or very low value (say less than 0.05dB), you may need to consult the manufacturer for suitability of the equipment.
-
Due to the limitations of the DUT/NF Analyzer, you may need to use external mixer for measuring NF. In such an event, ensure that the NF Analyzer supports external/internal mixer capabilities.
-
DUT Connectors: Some times, the DUT may have different connectors, such as waveguide. If so, you may need to procure appropriate waveguide to co-axial adapter. Most of the NF Analyzers use only co-axial connector for interconnectivity.
-
Gain Measurement: Normally, you measure gain along with NF. Ensure that the NF Analyzer is capable of measuring expected range of DUT Gain.
-
For frequency conversion, you may require external frequency generator, and a mixer. Most measurement (such as Up/Down Converters) require external frequency generator.
e. Advantages and disadvantages of this method:
1. Simple to measure Noise Figure and Gain
2. Accurate for small NF measurements
3. NF could be measured across a wide range of frequencies with external mixers.
2. Gain Method:
a. Formulas Used:
The Noise figure measurement using gain method is based on the following formulas:

=1+ Ndut]/[ GNin]
Or 10logF = 10log Ndut – 10 logNin
=10log Ndut – 10 log(KT0D fG)
If you consider per Hertz (normalized) bandwidth,
=10log Ndut –10logKT0 –10logG
=[10log Ndut – 174 – 10logG ] db/Hz
We know the constant KT0, which is equal to 174 dBm/Hz. Therefore, we can compute the NF in dB by measuring Ndut.
b. Measurement using Gain method:
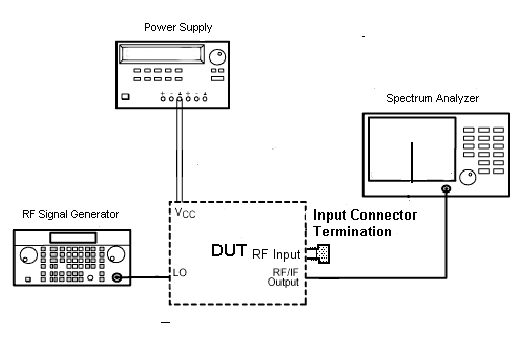
The diagram for measurement of NF using Gain method is shown below:

c. Advantages of using this method:
-
This method is very useful for measuring very high Noise Figure (or the order of 10dB or more).
-
The method is more intuitive, and useful for experimentation.
-
A spectrum analyzer can also be used to make other measurements such as amplifier harmonics, gain, etc. where as a NF analyzer is specifically made for NF measurements.
-
Gain method is recommended when making measurements at low frequencies, typically less than 10MHz.
d. Disadvantages of using this method:
-
The spectrum analyzer should be able to provide very good resolution bandwidth, and noise floor, typically of the order of –130dBm. A spectrum analyzer becomes very expensive when you need to measure very low signal levels such as –130dBm at high resolution bandwidths (typically few Hertz).
-
This method requires that the Gain of the DUT is known already. Also, the accuracy of Noise Figure measured depends directly on the accuracy of the measured Gain.
3. Y-Factor Method of Noise Figure Measurement:
a. What is Y-Factor:
The Y-Factor is the ratio of Hot and Cold noise powers (in watts) and is defined as
Y=Nh/Nc
If the Noise source is at room temperature, then Nc = N0 and the equation becomes,
Y= Nf/N0
Note that the Y factor method is a relative method and does not depend on the rest of the equipment. All you need is to measure the power levels accurately while the noise source is OFF and ON.
The noise figure is related to the Y factor as below:
F = ENR/[Y-1]
Note that the above parameters are in linear units. Normally, the ENR provided on the noise source is in decibels. This needs to be converted to linear units for computing the noise figure.
b. Advantages of this method:
-
The equipment required is less. You need a noise source and power meter to measure the power levels with noise source ON and OFF. Ofcourse, you need a mechanism to turn the noise source ON and OFF.
-
The method can be used to measure noise figure over a wide frequency range.
c. Disadvantages of using this method:
-
Due to the limitation of noise source, if the DUT noise figure is very high, the results may not be very accurate.
-
The other equipment needs to be stable so that you can get repeatable measurements.
7. Important Features that you need to look for when buying NF measurement equipment:
-
Measurement Frequency Range: Ensure that the NF measurement frequency range is covered completely. If not, you may need to use external signal generators and mixers to down-convert the signals before making noise figure measurements. Measurement frequencies up to 26.5 GHz in a single instrument is recommended if you will be using the equipment for Ku band frequencies.
-
Ensure that the NF analyzer can accurately measure the desired NF. For example, if you need to measure a fraction of a dB of noise figure, you may need to buy NF analyzers that are specifically built for measuring NF. Methods such as Gain Method use spectrum analyzers for NF measurement, and do not provide accurate and repeatable measurement.
-
Consider local support. The equipment may need to be calibrated once a year. A local calibration facility for the equipment is recommended. Normally for a new instrument, manufacturer assures measurement accuracies for the first 3 years. Please consult respective manufacturers before buying the equipment.
-
Accessories: Normally, you need several accessories along with the main instruments. Some of the accessories that you may need to plan before making a purchase decision are:
-
Connector adapters such as coaxial to coaxial or coaxial to wave guide adapters
-
Attenuators, it is recommended to procure precision attenuators with wide frequency range (typically 10KHz to 26.5GHz).
-
Noise Source with calibrated ENR table. Normally, the ENR table is stuck on to the device itself.
-
Any other components such as frequency mixers and cables.
-
Manuals: It is necessary that the manuals are provided with the equipment. Several equipment have specific settings to be made before making any measurements. Without a product manual, the task becomes very difficult.
-
Ease of Use: Flexible, intuitive user interface makes it easy to make the measurements.
8. Manufacturers: A few equipment manufacturers are given below:
1. Agilent Technologies
2. Anritsu
3. Scientific Atlantic